Introduction
The 2018 proxy season resulted in the highest say-on-pay failure rate since 2012. 51 companies or approximately 2.5% of the Russell 3000 companies during the period January 1, 2018 to June 30, 2018 received less than majority support on their say-on-pay proposal. Considering the full-year period from July 1, 2017 to June 30, 2018 there were 57 companies with a failed say-on-pay vote. In this report, Georgeson has analyzed the voting behavior of the top 10 investors at these 57 companies. We reviewed the voting data1 for the following top 10 investors (based on assets under management):
- BlackRock
- Vanguard Group, Inc.
- SSGA Funds Management, Inc. (State Street)
- Fidelity Management & Research Co. (Fidelity Management)
- BNY Mellon
- Capital Group (Multi-managed)
- Pacific Investment Management Co. (PIMCO)
- JPMorgan Investment Management, Inc.
- Goldman Sachs Asset Management LP
- Norges Bank Investment Management
Each of the investors owned shares and had voting information available for at least 42 of the 57 companies except for Fidelity Management, Capital Group and PIMCO, which had fewer holdings and more limited voting information. Of the top three investors, Vanguard Group owned shares and had voting information available for all 57 companies while BlackRock and State Street did for 55 companies. As discussed below, the analysis of the investors voting data provides some useful insights.
How Likely was an Investor to Vote Against a Say-on-Pay Proposal that Failed?
Almost all of the top 10 investors voted against greater than a majority of the say-on-pay proposals that failed. Only BlackRock and Fidelity Management voted against less than half of the failed proposals (see Figure 1). BNY Mellon voted against 9 out of every 10 proposals, or at 43 of the 48 companies where it owned shares.
Figure 1 - Percentage of Times Top 10 Investors Voted Against at Companies with Failed Say-on-pay Proposals
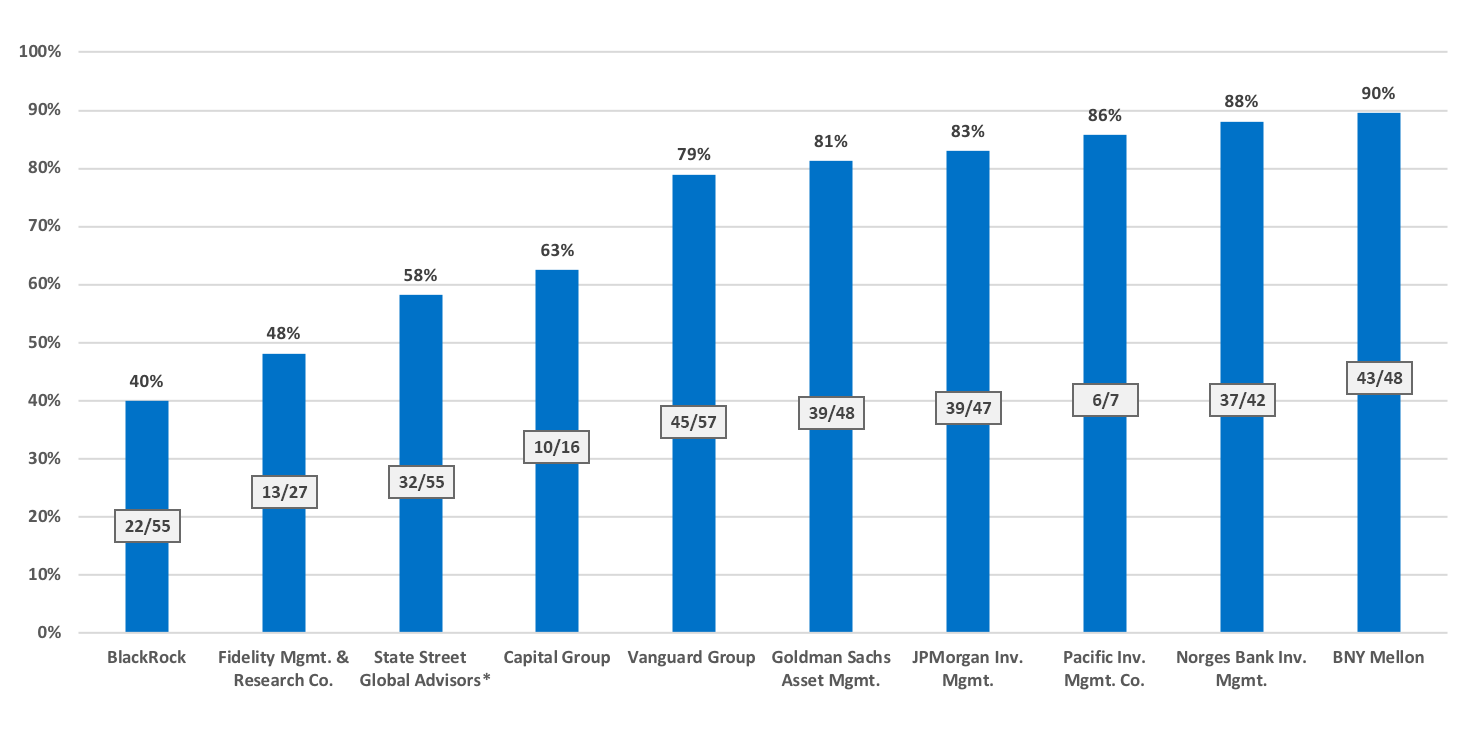
Note: Not all investors owned shares at each company or had information available as to how they voted.
*Does not include abstain votes
In addition to voting for or against, State Street also voted abstain during the 2018 proxy season to indicate a qualified support. State Street’s policy to vote abstain became effective in March 2018. State Street voted abstain in cases where it concluded that the company’s compensation practices were not fully aligned with its expectations, but not sufficiently misaligned to warrant an against vote. Of the 46 failed votes between the beginning of March and the end of June 2018, there were 9 instances2 (approximately 20% of the total) where State Street voted abstain. During this same period, State Street cast an against vote at 27 (approximately 59% of the total) or three times as many proposals.
How Likely was a Company to Receive an Against Vote from these Top 10 Investors?
The top 10 investors were mostly in alignment in identifying the companies that warranted an against vote as shown by the histogram distribution of their against votes in the chart below. The Figure 2 shows the number of companies receiving against vote across the varying level of opposition by the investors. As the level of opposition increased, so did the number of companies represented in that group. There were only two companies in the lower interval of the opposition, where 0% to 20% of the top 10 investors voted against. In the upper interval, there were 20 companies that received an against vote from 80% to 100% of the investors.
Figure 2 – Distribution of Top 10 Investors Against Votes
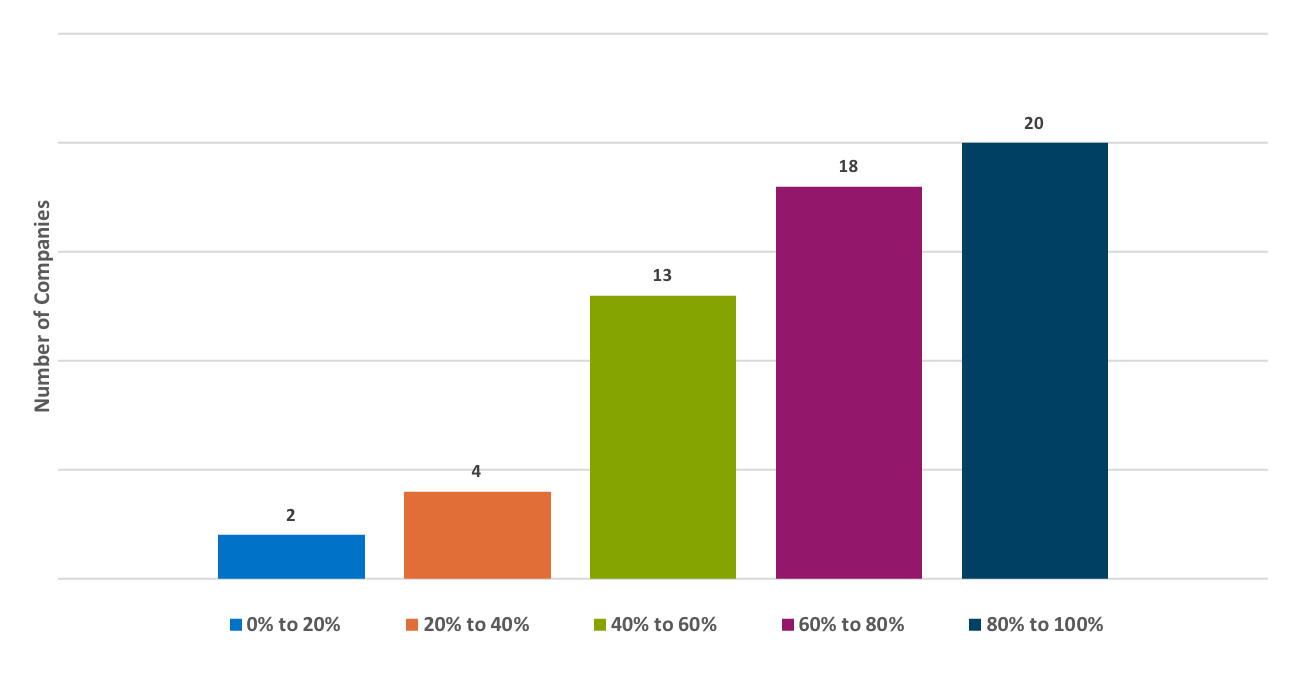
Note: Not all investors owned shares at each company or had information available as to how they voted.
For the two companies in the lower range of 0% to 20% opposition, none of the top 10 investors voted against.
- One of the two companies, Goodrich Petroleum Corporation, which had emerged from bankruptcy in 2016, had only two of the 10 investors with holdings in the company’s stock at the time of their 2018 annual meeting. The company had concentrated ownership with three shareholders holding approximately 50% of their voting stock, with each of them filing a 13D around the time of the company’s annual meeting.
- The other company, USG Corporation was owned by 8 of the top 10 investors and each of them voted in favor of the say-on-pay proposal. However, USG was the subject of a proxy contest and failed its say-on-pay vote due to opposition by its largest shareholder, Berkshire Hathaway, which owned approximately 31% of the company’s stock.
In the upper range of 80% to 100% opposition by the top 10 investors, 11 out of the 20 companies received an against vote from 100% of the top 10 investors that held shares of their stock. A review of ISS reports for these companies suggests that outsized equity grants, increase in pay opportunities despite share price underperformance, and lack of disclosure of performance goals for incentive payouts likely contributed to the widespread shareholder opposition.
- One of these 11 companies, Wynn Resorts, Ltd. was involved in a proxy fight. All top 10 investors owned shares and voted against the say on proposal.
- Three companies (Cleveland-Cliffs Inc., FleetCor Technologies Inc. and Bed Bath & Beyond Inc.) had nine of the top 10 investors with holdings in their stock, all voting against. In addition to the pay issues that resulted in shareholder opposition at their 2018 meeting, another common feature was a poor say-on-pay vote at their previous year’s meeting. Both FleetCor Technologies and Bed Bath & Beyond Inc. failed their vote at their 2017 meeting as well, while Cleveland-Cliffs Inc. had only 57% shareholder support.
What was the Influence of Top 3 Index Funds Investors?
The top three investors and the biggest passive managers BlackRock, Vanguard Group and State Street have more than US$13 trillion in total assets under management and hold significant voting influence. The three taken together, have the largest shareholding in 40% of all publicly listed firms in the United States.
We analyzed the influence of these investors by looking at their ownership3 at the 57 companies (see Figure 3). At these companies with failed say-on-pay votes, the big three owned an average of 18% of the shares outstanding and were responsible for a quarter of the votes that were cast. BlackRock and Vanguard Group each influenced on average approximately 11% of the vote while State Street’s influence was 5%.
Figure 3 – "Big 3" Ownership at Companies with Failed Say-on-pay Votes
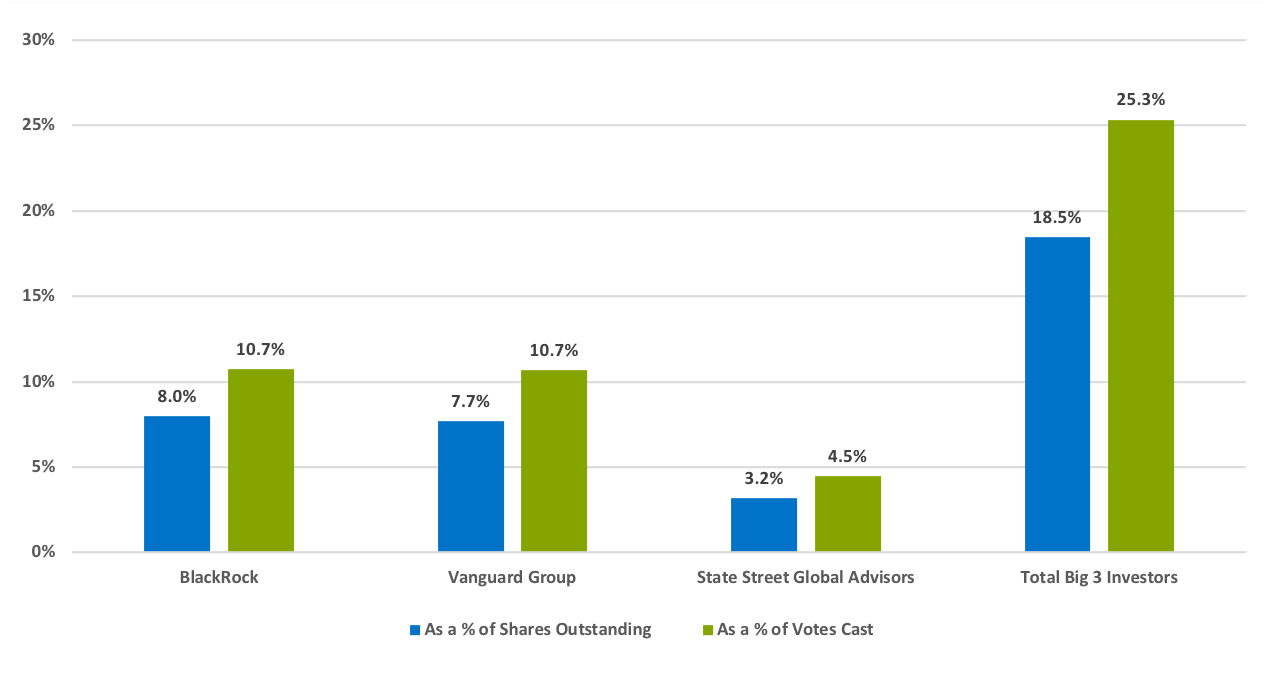
Note: Total average ownership is slightly different from the sum of individual average ownerships as BlackRock and SSGA did not have a position in two of the 57 companies.
The big three share ownership in these companies showed a wide range, with the highest combined ownership of approximately 47% of the shares outstanding at Tanger Factory Outlet Centers. 75% of the shares outstanding voted for the say-on-pay proposal giving these 3 investors an influence of almost 63% of the votes cast. BlackRock and State Street with 16% and 27% of the votes cast respectively supported the proposal, while Vanguard Group with 20% of the votes cast voted against.
The highest combined against vote of 42% of the votes cast was at Cleveland-Cliffs Inc., with all three voting against the proposal. The three investors owned approximately 19% of the shares outstanding but had outsized influence as only 46% of the outstanding shares voted for the say-on-pay proposal. 34% of the shares outstanding were broker non-votes representing retail shareholders who did not vote.
How Correlated Were the Votes of Any Two Investors?
While we expected to see generally positive correlation between investor votes given the average opposition of approximately 63% at these companies, we performed an analysis to assess the strength of correlation between the votes of any two investors (see Figure 4). It was surprising to find that no two investors showed a reading above 0.5 that would have suggested a strong positive correlation4. The highest correlation was 0.47, between BlackRock and Fidelity Management & Research Co. Vanguard Group’s votes showed the weakest correlation with those of any other investors, with a few even negatively correlated, although very slightly. It is interesting to note that two of the big three investors, Vanguard and State Street, showed almost zero correlation in their votes.
Figure 4 – Correlation Matrix of Top Investor Votes
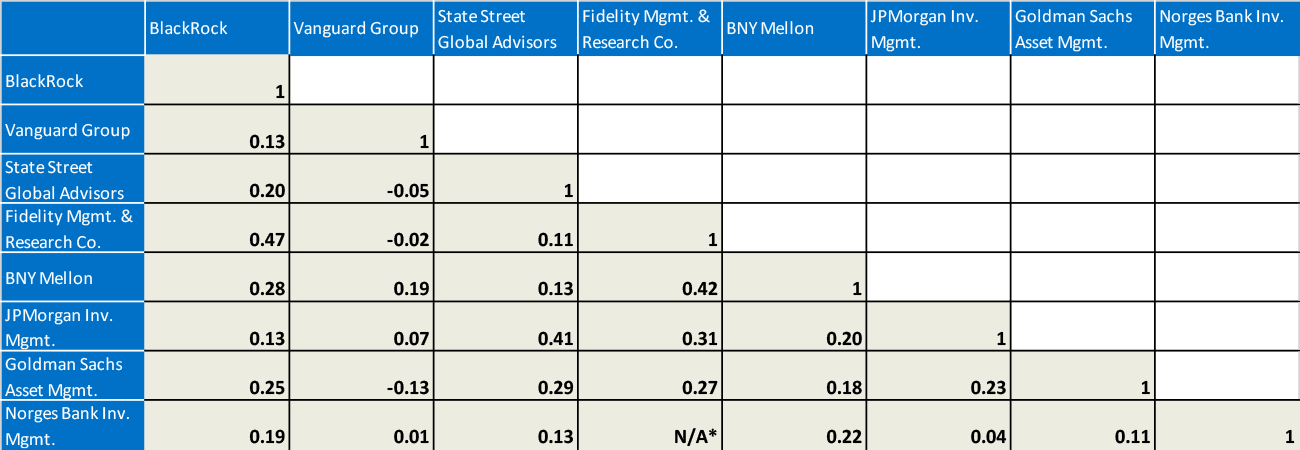
*Note, there weren't enough observations to calculate correlation between Fidelity Management and Norges Bank. Correlations for Capital Group and Pacific Investment Management Co. were excluded for the same reason.
Conclusion
Lack of strong correlation among investors’ votes at these failed say-on-pay proposals suggests that how one of the investors voted was not a strong signal as to how another one would vote. Early negative votes by some of these investors does not mean that others among these investors would be non-supportive, as well. It also means that engagement with investors should not be a one-size-fits all approach. Even among the key index investors, there are differences in the likelihood of gaining their support and the issues they focus on. Companies should understand the key issues an individual investor considers in its analysis, and in their outreach try to mitigate any concerns associated therewith. Demonstrating awareness of an investor’s priorities when communicating your story will show that you have done your homework and best position you to gain the investor’s support.
1We would like to acknowledge Proxy Insight, who provided the data used in writing this report. The data relates to the list of the companies with failed say-on-pay votes and their vote results, and the share ownership of the top 10 investors at these companies.
2State Street’s voting information is available for 55 out of the 57 failed companies. Of these, 9 failed say-on-pay votes occurred between 7/1/17 and 2/28/18 when State Street’s policy to vote ‘Abstain’ was not yet in place.
3For ownership information, we looked at the big 3 investors’ 13-F filings as of 3/3/1/18, which was the closest period to the meeting dates for the 57 companies.
4A perfect positive correlation is represented by 1, while 0 indicates no correlation, and negative 1 indicates a perfect negative correlation.
Appendix
| Issuer | Meeting Date | % For* | % For
(as of shares outstanding) | Quorum |
|---|---|---|---|---|
| Acacia Research Corporation | 14-Jun-18 | 20.43 | 15.28 | 75% |
| AECOM | 28-Feb-18 | 48.39 | 40.34 | 83% |
| Ameriprise Financial Inc | 25-Apr-18 | 25.31 | 20.15 | 80% |
| Axos Financial, Inc. | 26-Oct-17 | 46.37 | 28.15 | 61% |
| Bed Bath & Beyond Inc. | 29-Jun-18 | 21.41 | 16.54 | 77% |
| Boingo Wireless Inc. | 7-Jun-18 | 45.41 | 36.74 | 81% |
| Chesapeake Energy Corporation | 18-May-18 | 45.16 | 18.25 | 40% |
| Cleveland-Cliffs Inc | 24-Apr-18 | 32.34 | 14.79 | 46% |
| Cogent Communications Group Inc. | 2-May-18 | 49.68 | 43.83 | 88% |
| Commercial Metals Company | 10-Jan-18 | 44.55 | 37.49 | 84% |
| Digimarc Corporation | 30-Apr-18 | 42.04 | 20.50 | 49% |
| FCB Financial Holdings Inc | 14-May-18 | 33.2 | 30.18 | 91% |
| First Horizon National Corporation | 24-Apr-18 | 31.84 | 24.75 | 78% |
| FleetCor Technologies Inc. | 6-Jun-18 | 14.33 | 11.94 | 83% |
| Fluidigm Corporation | 31-May-18 | 49.17 | 39.50 | 80% |
| G-III Apparel Group, LTD. | 14-Jun-18 | 37.06 | 33.32 | 90% |
| GenMark Diagnostics Inc. | 24-May-18 | 28.6 | 22.65 | 79% |
| Gentherm Inc | 18-May-18 | 36.61 | 33.46 | 91% |
| Goodrich Petroleum Corporation | 23-May-18 | 44.51 | 25.74 | 58% |
| Halliburton Company | 16-May-18 | 42.58 | 30.80 | 72% |
| Hospitality Properties Trust | 14-Jun-18 | 41.59 | 30.56 | 73% |
| Huron Consulting Group Inc. | 4-May-18 | 39.85 | 34.98 | 88% |
| Imax Corporation | 5-Jun-18 | 43.17 | 34.41 | 80% |
| iStar Inc | 16-May-18 | 39.75 | 26.45 | 67% |
| LivePerson Inc. | 5-Jun-18 | 42.78 | 25.24 | 59% |
| Mattel Inc. | 17-May-18 | 45.77 | 38.40 | 84% |
| Maxar Technologies Ltd | 11-May-18 | 47.26 | 38.06 | 81% |
| McKesson Corporation | 26-Jul-17 | 26.58 | 20.99 | 79% |
| Medifast Inc | 13-Jun-18 | 41.16 | 31.94 | 78% |
| Mondelez International Inc. | 16-May-18 | 44.63 | 31.39 | 70% |
| Nabors Industries Ltd. | 5-Jun-18 | 40.73 | 36.19 | 89% |
| Nevro Corp | 21-May-18 | 20.39 | 17.71 | 87% |
| New York Community Bancorp Inc. | 5-Jun-18 | 33.2 | 22.08 | 66% |
| Nexstar Media Group Inc | 6-Jun-18 | 40.37 | 33.30 | 82% |
| Nuance Communications Inc. | 28-Feb-18 | 9.68 | 7.09 | 73% |
| Oracle Corporation | 15-Nov-17 | 48.64 | 39.73 | 82% |
| Palatin Technologies Inc. | 26-Jun-18 | 48.35 | 10.10 | 21% |
| Patterson-UTI Energy Inc. | 14-Jun-18 | 24.45 | 20.98 | 86% |
| Preferred Bank | 15-May-18 | 41.7 | 32.61 | 78% |
| Qualys Inc. | 18-Jun-18 | 38.82 | 32.66 | 84% |
| Rambus Inc. | 26-Apr-18 | 47.55 | 35.88 | 75% |
| Sandridge Energy Inc. | 19-Jun-18 | 12.85 | 10.79 | 84% |
| Sanmina Corporation | 5-Mar-18 | 30.71 | 25.96 | 85% |
| Synergy Pharmaceuticals Inc. | 12-Jun-18 | 29.35 | 12.86 | 44% |
| Tanger Factory Outlet Centers Inc. | 18-May-18 | 41.95 | 31.35 | 75% |
| Tutor Perini Corporation | 23-May-18 | 37.98 | 33.07 | 87% |
| United Natural Foods Inc. | 13-Dec-17 | 22.62 | 19.47 | 86% |
| Universal Insurance Holdings, Inc. | 13-Jun-18 | 42.13 | 32.87 | 78% |
| USG Corporation | 9-May-18 | 46.6 | 39.11 | 84% |
| Virtus Investment Partners Inc. | 15-May-18 | 46.23 | 38.25 | 83% |
| Virtusa Corporation | 7-Sep-17 | 37.25 | 36.00 | 97% |
| Walt Disney Company (The) | 8-Mar-18 | 45.5 | 29.99 | 66% |
| Waterstone Financial Inc. | 15-May-18 | 49.68 | 36.61 | 74% |
| Western Digital Corporation | 2-Nov-17 | 41.89 | 32.65 | 78% |
| Whitestone REIT | 17-May-18 | 37.22 | 25.04 | 67% |
| Wynn Resorts, Limited | 16-May-18 | 19.99 | 12.87 | 64% |
| Zoe's Kitchen Inc | 14-Jun-18 | 44.75 | 28.04 | 63% |
Note: % figures for for and against votes are calculated as a % of votes for and against.
Key Takeaways
- BlackRock supported the proposal at a more than a majority of these companies, while BNY Mellon showed the lowest support, voting against 90% of the companies
- Investors were mostly aligned in identifying companies that warranted an against vote
- The big three investors, BlackRock, Vanguard and State Street, on average influenced a quarter of the votes cast
- How one investor voted was not a strong signal of how another investor would vote. Investors’ votes were positively correlated but not strongly.
- Engagement should not be a one-size-fits all approach. Understanding the key issues an investor focuses on is important in communicating ones say-on-pay story to gain the investor’s support.